The Backstory
I’m a Houston boy. I was born there and grew up there. My family lives there. I lived there long enough to know that it’s a subtropical environment that, periodically, gets a deluge of rain. Some of the storms have names like Claudette, Allison, or Ike. Most of them do not, like the storm that sat over western and northwestern portions of the Houston area on April 17, 2016. Overnight on Sunday, large portions of Southeast Texas received as much as 20 inches of rain in a few hours. On Monday morning, many people woke up with water in places they’ve never seen it before. Sadly, several people lost their lives in the flooding and too many others lost their homes and much, if not all, of what they had. It was a truly devastating event for the entire city.
All that said, the catastrophic flooding could have been much worse. Addicks Reservoir and Barker Reservoir, built after floods that devastated what is now downtown Houston in 1935, did their jobs and held back rainwater that would have piled up in the urban core of Houston. The Army Corps of Engineers knew how to prevent floodwater using retention ponds upstream. They used mathematics to make their plans.
The Mathematics
Luckily, we know a lot more about how rainfall affects particular drainage areas. Weather forecasters know how fast water drains from a particular drainage basin. If they know how much rain fell in that drainage basin, they can use mathematical models that are based on data with many variables to predict the river or bayou level at a particular time.
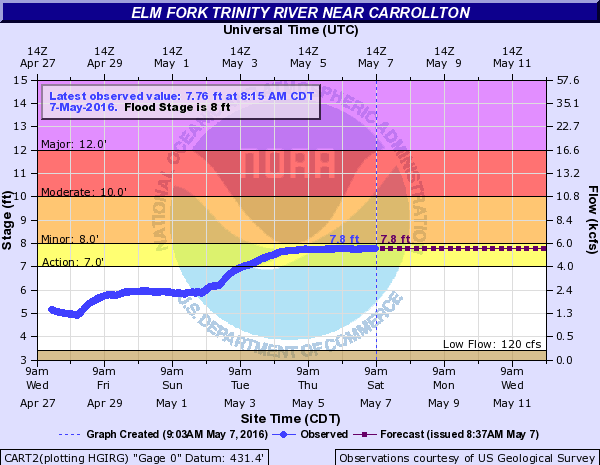
The Advanced Hydrological Prediction Service, a unit of the National Oceanic and Atmospheric Administration, maintains a network of river gauges that are monitored for flood conditions. On their website, you can obtain real-time graphs of river and stream levels. In normal weather conditions, the graphs are not very exciting, like the one showing the Elm Fork of the Trinity River near Carrollton, Texas, which is just beneath the Lake Lewisville dam in the Dallas area.
The graph shows that there is minor flooding as the Corps of Engineers lowers the level of Lake Lewisville gradually over time. But, the level of the river is being held fairly constant. Mathematically, this is not an exciting graph.
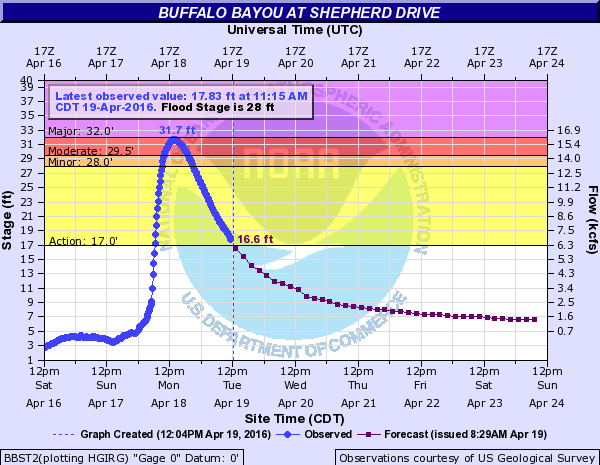
However, take a look at the graph from Buffalo Bayou at Shepherd Drive in Houston from the afternoon of April 19, just after historic rainfall on April 17-18.
When you look at this graph, what do you notice? What function families do you see in different intervals of the graph?
- If you see a quadratic function, what do you know about the rates of change of a quadratic function? Where is the vertex? Where is the river stage increasing or decreasing? When does the water level rise begin to slow down?
- If you see an exponential function, is an exponential growth or decay function? What would the base of the function be? What does that tell you about the change in water level over a constant time interval?
Not All Rivers Flow Equally
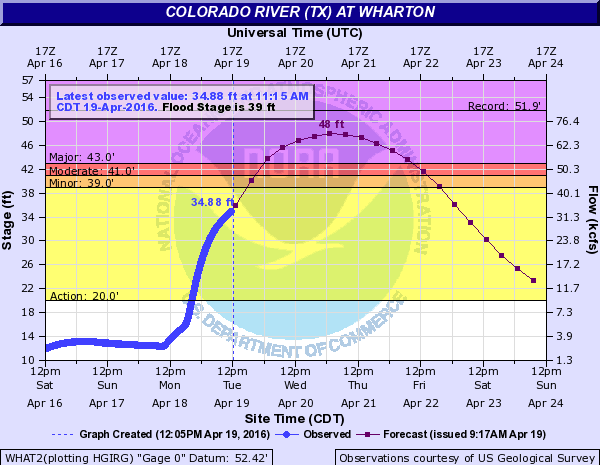
On the same night, parts of the Colorado River drainage basin upstream from Wharton, Texas, also received record rainfall. Since water flows downhill, much of that rain ended up in Wharton. Look at the graph of the river stage (height of the top of the river) versus time for the Colorado River at Wharton.
When you look at this graph, what do you notice? What function families do you see in different intervals of the graph? Why are those function families different from what you observed in the Buffalo Bayou at Houston graph?
The Conclusion
Flooding is a devastating event, to say the least. Property, homes, and lives are lost when floods strike. Hydrologists can use mathematics to create function models that allow them to predict how quickly river levels rise — and recede. The models that hydrologists actually use have many variables and are mathematically complicated. But for high school mathematics, we can use simplified models to give students a feel for how mathematics can be used to solve important real-world problems.


